El Niño

SupportBuy Me a Coffee

Why Google's WeatherNext 3?

WeatherNext 3 is Google DeepMind’s most advanced global weather AI — the same model family now behind forecasts in Search, Maps, and Gemini.

For decades the workhorses have been physics models: the American GFS, Europe’s ECMWF, and their cousins. They march the atmosphere forward by solving equations on a supercomputer. That science is remarkable, and it is also slow. A single global run can take an hour, so those centers typically refresh only a few times a day.

WeatherNext 3 learned the weather instead. Trained on decades of analyses and, in this generation, raw satellite imagery, it can draw a new global forecast in seconds — every hour, around the clock. You get a tighter watch on rain, wind, and temperature as they change, not a snapshot that is already six hours old.

It is also an ensemble: dozens of slightly different futures from the same start. This page shows the mean of those members, so the map is the most likely pattern, not one noisy roll of the dice. Surface fields, including station-scale temperature, are produced at about 5 km; winds and other surfaces at about 10 km.

In Google’s tests that mix of speed, hourly updates, and ensemble detail is competitive with — and on many scores ahead of — those legacy systems. It is still experimental research. Use it with GFS and the Euro, not instead of a National Weather Service watch or warning.

WeatherNext 3 experimental research data. Not an official forecast, watch, or warning, and not NWS. Do not use for life-and-property decisions.

DeepMind overview

These maps are free. Support pays the cloud bill.

This page checks NOAA on every forecast update, several times a day. The ocean map changes when a new daily file is out, usually a day or two behind today. The Niño numbers change once a week. The index, the pressure index, and the subsurface move about once a month. None of this is the 15-day WeatherNext forecast.

Checking NOAA…

Now

WEEKLY NIÑO 3.4
…
CPC weekly SST anomaly
OCEANIC NIÑO INDEX
…
3-month Niño 3.4 anomaly
Loading the latest indices…
SOUTHERN OSCILLATION
…
Monthly. Negative means El Niño.
EAST MINUS WEST
…
Niño 1+2 minus Niño 4. Positive is piled in the east.
WARM WATER VOLUME
…
Extra water warmer than 20°C along the equator.

The ocean today

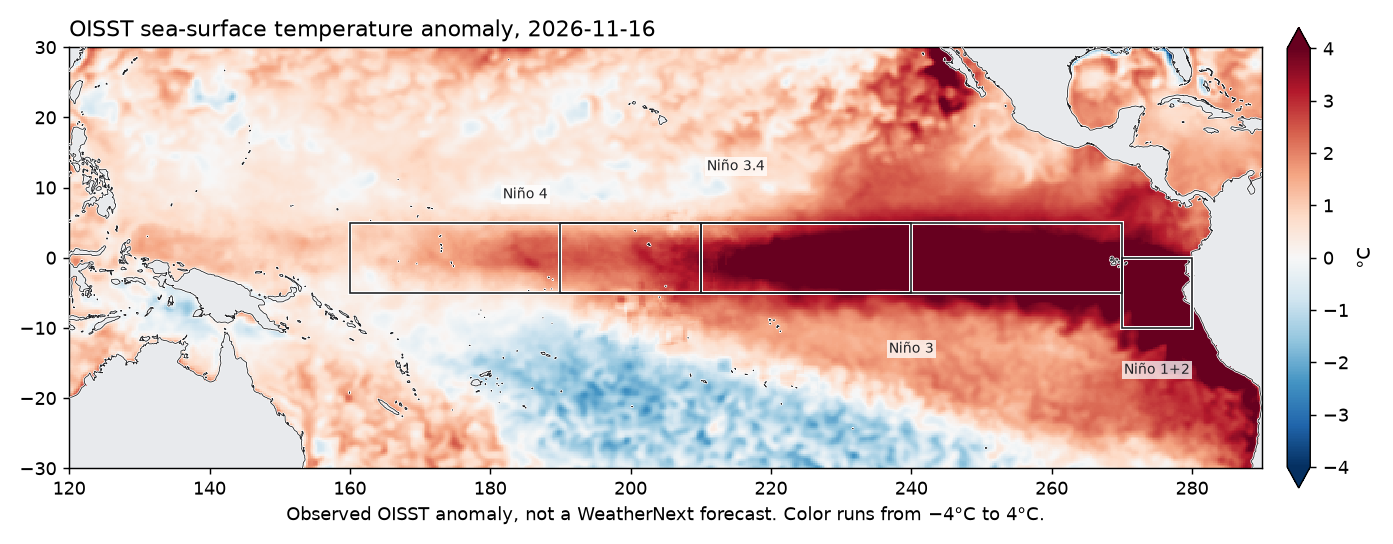
Observed sea-surface temperature anomaly, with the four Niño boxes. East is on the right. A warm event shows up as a red tongue along the equator from the dateline toward South America.

Tropical Pacific sea-surface temperature anomaly with the Niño regions outlined
NOAA OISST anomaly. Color runs from −4°C to 4°C. Hover a range to switch this map.
This week, west to east: Niño 4, 3.4, 3, and 1+2. Anomaly versus 1991–2020. Hover a bar for the value.
One value per day, from the daily OISST file. Hover a point for that day. The newest days are preliminary and can move a few hundredths. This is not the official ONI, which is a 3-month average.

How it has been changing

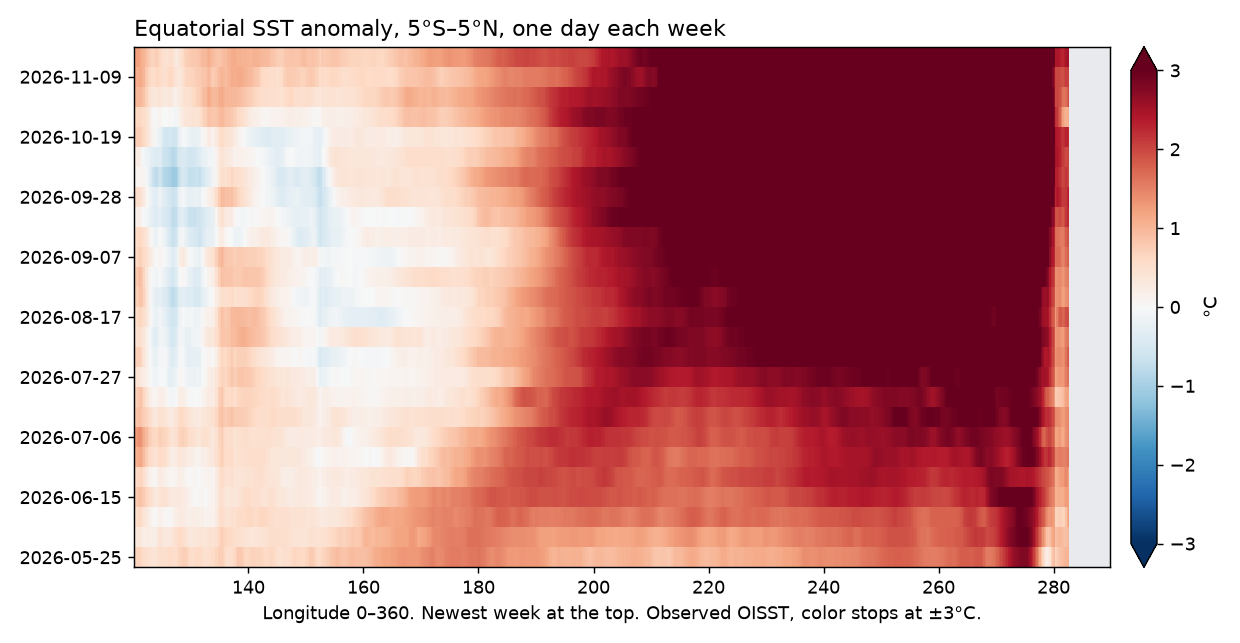
The heavy line is Niño 3.4, the region the index is based on. The other three show whether the warmth is piled in the east or spread across the basin. Hover a chart to read the date and the value. Below that, each row of the longitude plot is one day, a week apart, averaged from 5°S to 5°N. The newest week is at the top.

CPC weekly indices. Dashed lines are ±0.5°C. Hover for the week and each region.
East minus west, and the big El Niño years
Above zero, the eastern Pacific is warmer than the west relative to normal.
The heavy line is the current two-year window. The others are the big El Niño years, lined up on January.
Equatorial Pacific sea-surface temperature anomaly by longitude for the last six months
OISST anomaly along the equator, one day each week. Longitude runs 120°E to 70°W, same window as the map.
The official index lags the weekly number. Hover for the season. A named El Niño or La Niña is five overlapping seasons past ±0.5°C, not one warm month.

Under the surface

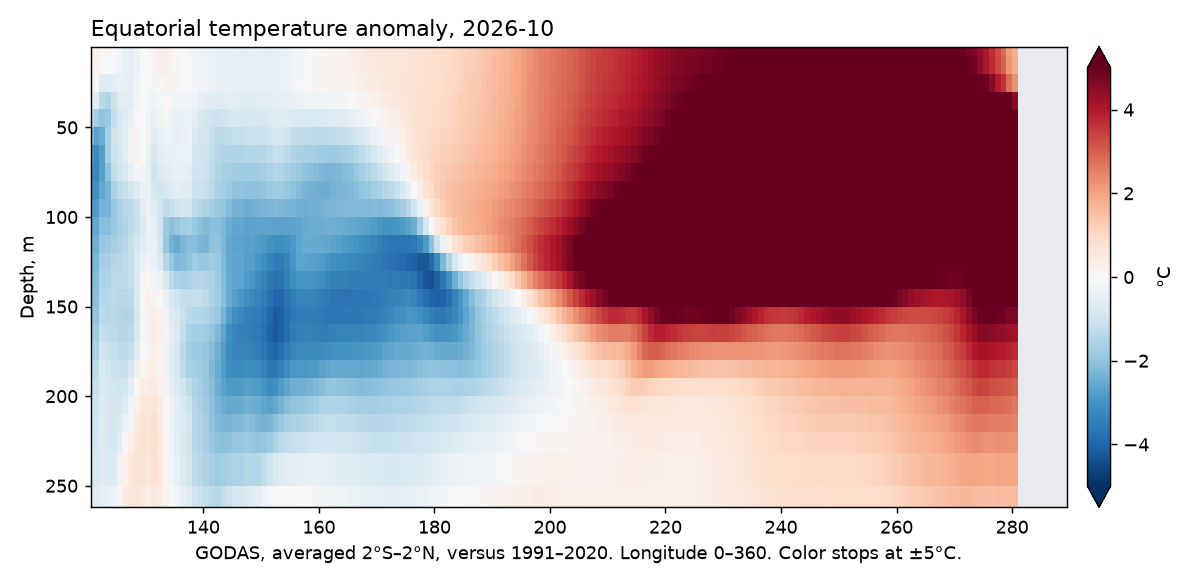
The daily map is only the skin of the ocean. This section is the upper 300 meters along the equator, from a monthly ocean analysis, so it lags the map by a few weeks. Red at depth, especially toward South America, means warm water is still down there. Warm-water volume, in the closed section under the image, is how much water warmer than 20°C is in the equatorial Pacific compared with normal.

Equatorial Pacific temperature anomaly from the surface to 300 meters
GODAS temperature anomaly, 2°S–2°N, versus 1991–2020. Depth increases downward.
Warm-water volume
PMEL warm-water volume anomaly. Positive is extra warm water along the equator. Hover for the month.
The atmosphere

A hot ocean is only half of an El Niño. The Southern Oscillation Index is Tahiti’s air pressure minus Darwin’s. Negative means the atmosphere has shifted toward the El Niño pattern.

CPC monthly index. Negative is the El Niño side, the opposite sign from the ocean temperature. Hover for the month.
What a winter like this usually does

The first two charts in California, the Pacific Northwest, and southern Alaska are the latest complete month, versus that same month in 1991–2020. One month swings more than a winter. The charts under those are past winters whose December–February Oceanic Niño Index fell inside an official El Niño episode. That mean includes El Niño winters. A strong event is not a promise that this winter matches the bars. Southern California has had dry El Niño winters.

California

In those winters the south and the central coast were more often wetter than the 1991–2020 normal, which fits a storm track that sends atmospheric rivers into the state. Northern California moves around more from one El Niño to the next. The charts are the climate-division record, not this year’s forecast.

Pacific Northwest

The precipitation departures here are small next to southern California: a few percent drier in eastern Oregon, the Cascades, and the Palouse, and close to normal on the coast. The second chart is temperature. A south-shifted storm track is the usual telling of these winters, and these winters do not all follow it.

Hawaii

El Niño winters are often described as wetter in the islands, and the signal is less one-sided than in southern California. The nClimDiv division files behind the other charts do not include Hawaii, so this card has no bar chart. The Hawaii maps are the place to watch the next 15 days.